Much has been written about Leonardo Fibonacci, the gifted thirteenth-century Italian mathematician. Born in Pisa around 1170, Fibonacci not only introduced the modern use of decimal points, but also discovered the so-called Fibonacci sequence. The sequence begins with 0 and 1, and then adds the previous two numbers to produce a third, e.g. 0, 1, 1, 2, 4, 5, 8, 13, 21 etc. The sequence then continues onwards to infinity.
These numbers are seen as the “key” to nature, with the reproduction cycles of rabbits, branching patterns seen in plant life, and the “golden mean” used in art and architecture all corresponding to this mathematical sequence. Fibonacci discovered that the ratios in this sequence not only recur in nature but can also be seen in markets to indicate likely retracement levels.
Identifying support and resistance
As the study of Fibonacci numbers has become more accepted, areas of support/resistance have become more important. Levels of potential future resistance, in conjunction with other trading tools such as chart patterns, oscillators, and volume, can provide a greater measure of probability.
We work with the Fibonacci ratios as a means of predicting where future areas of possible share price support and resistance lie. First, the share trader/investor needs to have an opinion of what the share price has done in the recent past. The key question is, “has the share price broken out of a recent uptrend or has it broken out of a recent downtrend?”
Once this break has been identified, then the trader/investor can apply the Fibonacci ratios to see probable future areas of resistance and/or support. Thankfully, most charting software allows us to plot Fibonacci retracements with a simple click of a bottom.
Applying the Fibonacci ratios to the counter trend, we can identify points of possible share price targets if the stock price continues to fall. This provides the trader with possible key target points that they can apply to their individual trading strategies.
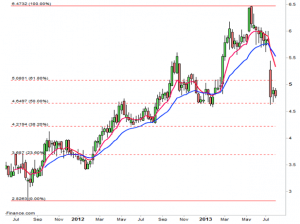
For example, once we have established a break in an uptrend, we plot a Fibonacci retracement from the previous trough to the recent peak.
We can then identify the key price points that correspond to the major Fibonacci levels, beginning from peak to trough, i.e. from 100% to 61.8% to 50% to 38.2% to 23.6% to 0%.
Using a weekly chart of Treasury Wine Estates (TWE), we can see how the stock has ‘reacted’ around the 50% retracement in recent weeks. A break below this level could precede a downside extension to the 38.2% retracement around $4.22.
Fibonacci ratio levels are always key points to evaluate profit risk/reward returns on existing trades, and also provide points to enter the market looking for a bounce in the share price. It all depends upon your viewpoint.
These levels of potential future resistance/support, in conjunction with other trading tools such as share patterns, oscillators, volume and the underlying move of the index, can provide a greater measure of probability in your trading.

