Some foreign exchange traders regard oscillator divergences as the holy grail of technical analysis. Others consider these elusive chart patterns to be virtually useless. The truth probably lies somewhere in between.
The purpose of classic divergence is to recognize a technical imbalance between price and oscillator, with the assumption that this imbalance will signal an impending directional change in price.
In the paragraphs below, we will explain two trades that were made because of several MACD histogram divergences that appeared on the USD/JPY daily charts. The first trade turned out like a dream. The second left much to be desired.
The Divergence Trades
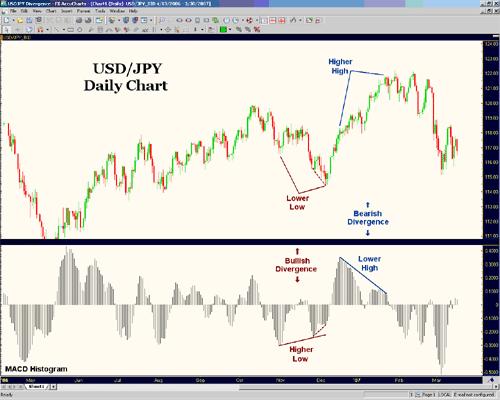
As you can see in the dollar/yen daily chart in Figure 1, these two divergence signals occurred relatively close to each other, between the last months of 2006 and the beginning of 2007.

The Setup
For the first signal (in dark red), which occurred between November and December of 2006, we have almost a textbook case of classic bullish divergence. Price drastically hit a lower low while the MACD histogram printed a very obvious higher low. According to proponents of divergence trading, this type of price-oscillator imbalance foretells a price correction of the imbalance. In this case, the correction in price would need to have been a directional change to the upside.
That is exactly what happened. Like clockwork, as evidenced by the chart above, price turned up in early December and did not look back until the second divergence was completed.
This first divergence signal was so strong that there was even a mini divergence (shown in Figure 1 with dark red dotted lines) within the larger divergence that helped to confirm the signal to go long. Luckily, some of the subsequent bull run was caught as a result of spotting this very clear divergence signal early on. Anyone who caught this particular divergence play was richly rewarded with almost immediate profit gratification. Below, we will explain the method I used to trade it.
The Trade
The second divergence signal (seen in dark blue), which occurred between mid-December 2006 and mid-January 2007, was not quite a textbook signal. While it is true that the contrast between the two peaks on the MACD histogram’s lower high was extremely prominent, the action on price was not so much a straightforward higher high as it was just one continuous uptrend. In other words, the price portion of this second divergence did not have a delineation that was nearly as good in its peaks as the first divergence had in its clear-cut troughs.
Whether or not this imperfection in the signal was responsible for the less-than-stellar results that immediately ensued is difficult to say. Any foreign exchange trader who tried to play this second divergence signal with a subsequent short got whipsawed about rather severely in the following days and weeks.
However, exceptionally patient traders whose last stop-losses were not hit were rewarded with a near-top shorting opportunity that turned out to be almost as spectacularly lucrative as the first divergence trade. The second divergence trade did not do much for from a pip perspective. Nevertheless, a very significant top was undoubtedly signaled with this second divergence, just as a bottom was signaled with the first divergence trade.
Making a Winning Divergence Trade
So how can we best maximize the profit potential of a divergence trade while minimizing its risks? First of all, although divergence signals may work on all timeframes, longer-term charts (daily and higher) usually provide better signals.
As for entries, once you find a high-probability trading opportunity on an oscillator divergence, you can scale into position using fractionally-sized trades. This allows you to avoid an overly large commitment if the divergence signal immediately turns out to be false. If a false signal is indeed the case, stop-losses are always firmly in place – not so tight that you get taken out by minor whipsaws, but also not so loose that the beneficial risk/reward ratio will be skewed.
If the trade becomes favorable, on the other hand, you can continue to scale in until your intended trade size is reached. If momentum continues beyond that, you should hold the position until momentum slows or anything larger than a normal pullback occurs. At the point that momentum wanes, you then scale out of the position by taking progressive profits on your fractional trades.
If a choppy, directionless market is prolonged, as in the case of the second divergence signal that was described above on USD/JPY, it should prompt you to cut your risk and go hunting for a better divergence trade.
Ready to learn more? Check out this article on forex market sentiment indicators.
