The closing price has a bigger influence on Woodie’s Pivot Point as it does on the Exponential Moving Average. Many traders believe that the high and low prices are a result of emotions in the heat of the battle, while the opening and closing prices are a more accurate representation of the mood of the market. The best way to show the difference is to calculate both Pivot Points for the February 24th session. The Classic Pivot Point is calculated using the high, low and closing prices from February 23rd, which for the EUR/USD were:
High – 1.3691
Low – 1.3496
Close – 1.3504
The formula for calculating the Classic Pivot Point is to simply add these three price levels and then to divide by three.
1.3691 + 1.3496 + 1.3504 = 4.0691/3 = 1.3564
Woodie’s Pivot Point is calculated by using the high and low prices from February 23rd and the open price from February 24th, which for the EUR/USD were:
High – 1.3691
Low – 1.3496
Open – 1.3504
It is not unusual for the close from one session to be the same price as the open for the next since the FX markets trade 24 hours a day.
The formula for calculating the Woodie’s Pivot Point is to simply add the high price to the low price and then to add the opening price twice, and then to divide by four.
1.3691 + 1.3496 + 1.3504 + 1.3504 = 54195/4 = 1.3549
You can see how the most recent price is given greater emphasis in Woodie’s Pivot Point formula, much the same way an Exponential Moving Average emphasizes the most recent closing prices over earlier closing prices in its calculation.
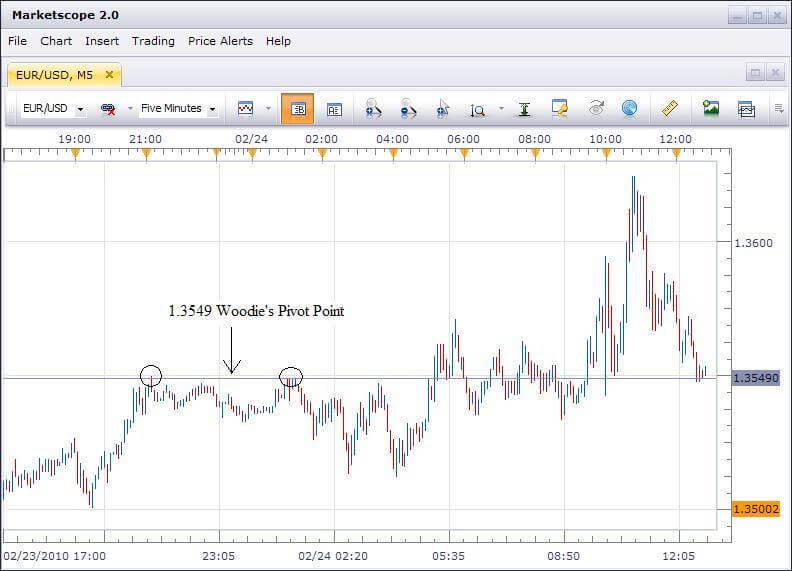
This 5-minute chart of the EUR/USD shows how the 1.3549 Woodie’s Pivot Point offered resistance before the eventual break up through that level as a result of the release of a scheduled US economic report . The market opened below the Pivot Point, so the trader would initially have a bearish bias, meaning that looking for sells was the preferred play.

Pivot Points can be a valuable tool for the day trader since these support and resistance levels offer a reference point to use in a complete approach to trading.
Camarilla pivots
Professional traders always are in search of key levels that either repel price or, after trading through it, accelerate price action in a predictable direction. The Camarilla pivot point trading strategy is a technique that has an astounding accuracy in both regards, with particularly reliable performance for day-trading equities. Camarilla pivot points were discovered in 1989 by Nick Scott, a successful bond trader. The basic thesis for this strategy is a common one: That price, as most time series, has a tendency to revert to its mean, right up until the point it doesn’t.
As compared to classic pivots where traders look for Resistance 1 and Support 1 levels, the most important levels for the Camarilla pivot point variation are the third and fourth levels. Examples of each level, along with what might be considered an appropriate trade action, are shown here:
| Level | Price | Action |
| Resistance 4 | 1422.82 | Long breakout |
| Resistance 3 | 1419.16 | Go short |
| Resistance 2 | 1417.95 | |
| Resistance 1 | 1416.73 | |
| Support 1 | 1414.29 | |
| Support 2 | 1413.07 | |
| Support 3 | 1411.86 | Go long |
| Support 4 | 1408.20 | Short breakout |
Camarilla pivot point calculations are rather straightforward. We need to input the previous day’s open, high, low and close. The formulas for each resistance and support level are:
- R4 = Close + (High – Low) * 1.1/2
- R3 = Close + (High – Low) * 1.1/4
- R2 = Close + (High – Low) * 1.1/6
- R1 = Close + (High – Low) * 1.1/12
- S1 = Close – (High – Low) * 1.1/12
- S2 = Close – (High – Low) * 1.1/6
- S3 = Close – (High – Low) * 1.1/4
- S4 = Close – (High – Low) * 1.1/2
The calculation for further resistance and support levels varies from this norm. These levels can come into play during strong trend moves, so it’s important to understand how to identify them. For example, R5, R6, S5 and S6 are calculated as follows:
- R5 = R4 + 1.168 * (R4 – R3)
- R6 = (High/Low) * Close
- S5 = S4 – 1.168 * (S3 – S4)
- S6 = Close – (R6 – Close)
Camarilla Trading Strategies
Camarilla pivot points are interesting in that they offer guidance for both sideways and trending markets. Depending on the price levels in play, the indicator can suggest a trade that would exploit a reversion to the mean or a breakout to new highs or lows. Let’s walk through various hypothetical trading scenarios to demonstrate the utility of this approach.
Scenario 1: Price opens at or between Support 3 and Resistance 3
When price opens between S3 and R3, we will use the following rules to guide our trade execution:
- Long trades: Let the price move to S3. At S3, go long with a stop loss placed five ticks below S4. Profit targets for this trade are R1, R2 and R3.
- Short trades: Let the price move to R3. At R3, go short with a stop loss placed five ticks above R4. Profit targets for this trade are S1, S2 and S3.
The Financial Bull 3X Direxion (FAS) exchange-traded fund (ETF) tracks the value of financial sector stocks and provides roughly three times the leverage of cash positions in these stocks.
On Aug. 14, FAS had the following: Open, 94.50; high, 95.14; low, 92.55; close, 93.35. Based on these values, our Camarilla pivot point resistance and support levels are:
- R1 = 93.59; R2 = 93.82; R3 = 94.06; R4 = 94.77
- S1 = 93.11; S2 = 92.88; S3 = 92.64; S4 = 91.93
Thus, the trading strategy for Aug. 15 is:
- Buy at 92.64. Stop loss: 91.88; Profit targets: 93.59, 93.82, 94.06
- Sell at 94.06. Stop loss: 94.82; Profit targets: 93.11, 92.88, 92.64
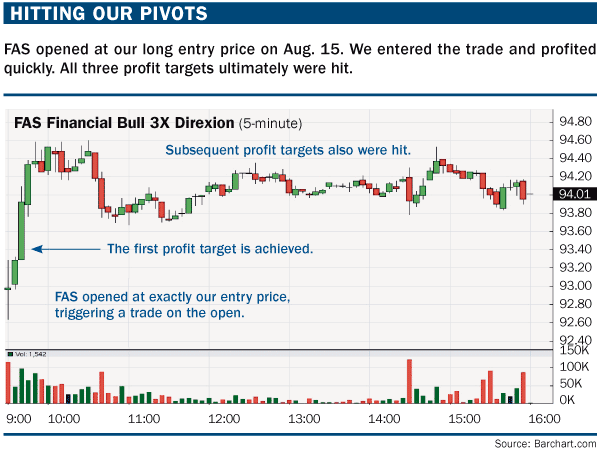
The trade worked out. On Aug. 15 FAS opened at the lower end of the range and our long trade at S3 (92.64) was triggered immediately. Price quickly reached our price targets, and we scaled out of the trade (see “Hitting our pivots,” below). Another helpful risk-control guideline is to manage the stop loss actively. In this case, we moved the stop loss to the entry price when the first profit target was hit.

Fibonacci Pivot Points
Fibonacci Pivot Points start just the same as Standard Pivot Points. From the base Pivot Point, Fibonacci multiples of the high-low differential are added to form resistance levels and subtracted to form support levels.
Pivot Point (P) = (High + Low + Close)/3

Support 1 (S1) = P - {.382 * (High  -  Low)}

Support 2 (S2) = P - {.618 * (High  -  Low)}

Support 3 (S3) = P - {1 * (High  -  Low)}

Resistance 1 (R1) = P + {.382 * (High  -  Low)}

Resistance 2 (R2) = P + {.618 * (High  -  Low)}

Resistance 3 (R3) = P + {1 * (High  -  Low)}
I hope this article has shown you more about Pivot Point and how useful they are. Do you have a favourite?
Ready to learn more? Check out this article on the best times to trade.
