How Fibonacci Numbers Can Be Used in Forex Trading?
Fibonacci trading is not complicated. By using the Fibonacci numbers on the charts, you can find more supports and resistances. It will be a big help to choose the right direction and avoid taking wrong positions.
To use the Fibonacci numbers on the charts, you have to find the top and the bottom of the previous trend. When the previous trend is a downtrend, you draw the Fibonacci levels from top to the bottom and extend the lines in the way that they cover the next completing and ongoing trend. When the previous trend is an uptrend, you draw the Fibonacci levels from bottom to top and extend the lines in the way that they cover the next completing trend.
>>> You have to wait for the trend to become matured: You can not draw the Fibonacci levels while the trend is not matured. When you can not find a completed trend in a time frame, you have to look for one in a smaller or bigger time frame in the same currency pair or stock.
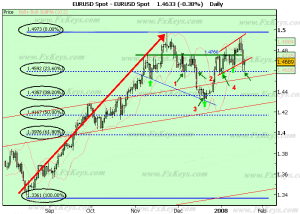
For example, on the below chart – the Fibonacci levels from the beginning of an uptrend that was started on 16 Aug 2007 to the end of it that was on 23 Nov 2007.
Now let’s see how Fibonacci levels worked as support and resistance in the next trend.
Follow the red numbers on the below chart:
1. The price that started to go down on 23 Nov 2007, touched the 23.60% level on 5 Dec 2007. This level worked as a support and so the price went up as soon as it touched the level but then went down to retest the 23.60% level.
As you know, usually when the price cannot break a support or resistance, it tries to retest later and sometimes it can break them after retesting.
2. So the price went up, but tried to retest the 23.60% level eight days later on 14 Dec 2007 and succeeded to break the 23.60% level this time and so went down.
3. The price touched the 38.20% level on 17 Dec 2007 and tried to break it for five days, but failed and so started to go up on 23 Dec 2007. It touched the 23.60% level when it was going up and could break it without any problem on 27 Dec 2007.
4. On 31 Dec 2007 it went down to test the 23.60% as a support. On 2 Jan 2008 it failed and went up.
5. Currently (17 Jan 2008) it is retesting the 23.60% level once again as a support and if this time it breaks the 23.60% level, it will go down and if not, it will go up.
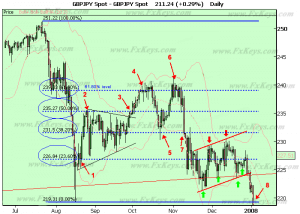
Let’s look at another example. Follow the red numbers on the below chart:
There was a big downtrend in the GBP/JPY that started on 22 July 2007 and ended on 17 Aug 2007. So – the Fibonacci levels from the top to the bottom (from 22 July 2007 to 17 Aug 2007).
1. While going up, the price touched the 23.60% level on 20 Aug 2007 and could break it easily, but on the next day it went down to retest the 23.60% level as a support. It could not be broken and so the price went up.
2. The price didn’t show any reaction to the 38.20% level as a resistance and went up, but was stopped by the 50% on 26 Aug 2007. From 26 Aug to 1 Oct 2007, price went up and down between the 23.60% and 50% levels. During this period of time, the 38.20% level worked as support and resistance several times and it seemed that the price was rotating around the 38.20% level. It made a consolidation around the 38.20% level.
3. The 50% level was broken finally on 1 Oct 2007 and the price went up.
4. It had a hard time in breaking the 61.80%. It tried for ten days from 5 to 16 Oct 2007 to break the 61.80% level, but failed and bounced down.
5. While going down, it passed through the 50% level without any problem, but was stopped by the 38.20% level that acted as support on 22 Oct 2007. It went up on 23 Oct, tested the 50% level, went down on 24 Oct and then tested the 50% on 29 Oct and could break it up.
6. On 31 Oct 2007, it reached the 61.80% once again and tried for several days but failed again, went down and made a double top.
It became completely disappointed about going up and retesting the 61.80% level, because it went much lower after it failed to break the 61.80% level.
7. On 9 Nov 2007 it broke the 38.20% level and made a consolidation around the 23.60% level. Like the 61.80% level, the 23.60% level acted as support and resistance several times and a consolidation was formed around it.
As you know, consolidations including, triangles, wedges, pennants and channels are continuation patterns. It means the price will go to the same direction that it was used to go before the consolidation forms.
8. Finally it went down, broke the 0.00% level on 2 Jan 2008.
Can you ignore the Fibonacci numbers in your trades?
As you see the impact they have on the market is not negligible and indeed it is highly considerable. I know this question is formed in your mind that why they have such a strong impact on the market. Why price become stopped sometimes for several days below or above Fibonacci levels?
(Of course if you use the Fibonacci levels in the bigger time frames like weekly and monthly charts, you will see that sometimes price becomes stopped by one of the Fibonacci levels for several weeks or months.)
The answer of this question has no impact on our trading. I mean whether you know the reason or not, you can use Fibonacci levels in your trades. I know most of you don’t care about the answer, but some of you are eager to know.
Well! If Fibonacci numbers are used in the formation of our body, from our genes (DNA molecule) to our internal and external organs, So they are also effective in our behaviour.
And markets go up and down because of the behavior of traders: Buying and Selling >>> Bulls and Bears.
Therefore, markets react to Fibonacci levels.


