You may have heard to the old business cliché “buy low and sell high”. New forex traders usually ask the question how low is low and how high is high. One way we can quantify these levels is using areas where price has stopped and changed direction. The area where price stops after moving up and then turns around is called resistance. Resistance acts as a “ceiling” capping the further advance of price.
Resistance is not just some random area where price turns around. There are potential sellers, traders who have sold a Forex currency pair once before and remember the collective power they had to push price lower. There are also buyers who went long at support and were disappointed that price did not go higher and will close their buy positions with sell orders at or just before price gets to the resistance ceiling.
Another group that make up resistance are the ones that bought at or near resistance and are trapped when price fell at resistance. These traders are begging for price to come up one more time to get them out at breakeven. All of these groups work together to send prices lower and make up the “supply” in the supply and demand equation. More supply than demand, price falls, more demand than supply price rises; Resistance=Supply.
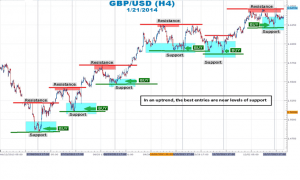
In the chart above of GBPUSD levels of support are highlighted in blue while levels of resistance are highlighted in red. In an uptrend, traders look to buy at support and take profits at the next level of resistance. By entering at or near significant levels in an uptrend, Forex traders can reduce their risk exposure and get a trading opportunity with an excellent risk to reward ratio. Forex traders are able to identify several places to trade with the trend. The levels of resistance can be used as profit target areas or breakout opportunities as price closes above resistance.
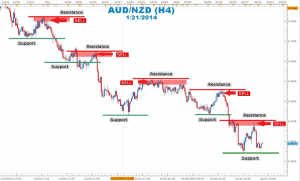
On the other hand, levels of significant resistance provide ideal entry points in a downtrend. They clearly show countertrend buyer exhaustion at point when sellers return. . The next level of support can be used as a target area. Support can also be used as a breakout entry area if price closes below support.
The balance of power is clearly revealed at areas of support and resistance. Price can bounce from a floor and move up to the ceiling and then bounce down. It is important for Forex traders to first identify trend direction and then choose to buy at support in an uptrend or sell at resistance in a downtrend. Additionally, oscillators like RSI and stochastics can be used to identify significant areas of support and resistance.
Ready to learn more? Check out this article on how to trade triangle patterns.


