Of all the technical indicators you are likely to encounter, Fibonacci Retracements could very well be the least “scientific”.
Nevertheless, there are many analysts who feel Fibonacci ratios are an important technical indicator.

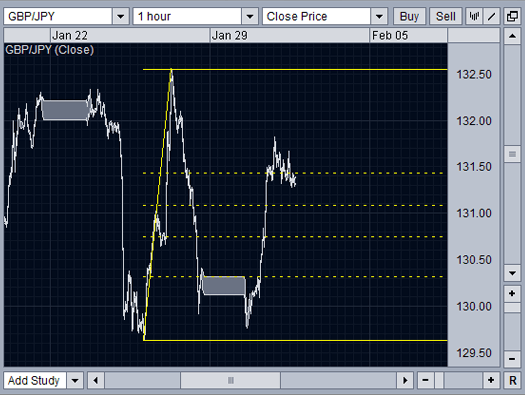
In the image above, note that we are basing our analysis on a 1-Hour Closing Price chart. You can see that within the past twenty-four hours, the rate fell from a recent high, and then tested the previous level of support before reversing.
By placing the Fibonacci lines over the price chart and extending the lines past the current spot rate, you can locate each of the potential retracement points and, if you wish, adjust your trading strategy based on this feedback.
In this example, the retracement levels show possible support and resistance levels as the rate retraces upwards. If the exchange rate is below a retracement level and the trend displays upwards momentum, you may wish to consider the next Fibonacci level as a potential future resistance level for the currency pair.
In the case of a downtrend of course, you must take the opposite approach. When trending downwards, each Fibonacci retracement level identifies a potential support level where traders begin to buy the currency pair, thereby reversing the downtrend.
When it comes to Fibonacci ratios and currency pair retracements, there may be more at play than first meets the eye. Few traders would argue that on its own, the Fibonacci Sequence has a direct affect on currency prices. However, if enough market participants believe that a retracement could occur near a Fibonacci ratio level and act accordingly, then all those pending orders could impact the market price.
Fibonacci Retracements are considered a predictive technical indicator as they attempt to identify a future exchange rate. As you can imagine, trying to predict, or as some would say, “guess”, future prices is to say the least, risky. When it comes to using Fibonacci Retracements as a technical indicator, trader discretion is advised.
IDENTIFYING SWING HIGH AND SWING LOWS
There are a couple of key price chart patterns that can help identify swing high and swing low points.
SWING HIGH / SWING LOW DETERMINATION
A swing high is typically identified by a recent high, with two lower highs on the left and right of the high itself. This is known as a head and shoulders pattern.
A swing low is typified by a recent low with at least two higher lows on either side of the low in what is known as a reverse head and shoulders pattern.
SETTING STOP LOSES BASED ON FIBONACCI RETRACEMENTS
One strategy used by some traders is to use Fibonacci Retracement levels as guidelines for placing stop loss limits.
For example, when prices are trending upwards and you hold a long position, one consideration is to place the stop loss just below the latest swing low rate. Because the swing low rate sometimes becomes a level of support, a falling price may recover before it actually falls through a previous support level.
Setting the stop loss just below the support level minimizes the potential loss as the stop loss is only triggered if the exchange rate falls below an established support level.
When trading in a downtrend and you are short the currency pair, the usual approach is to set a stop loss just above the swing high as this could represent a potential resistance level.
Once again, the thing to remember is that the rate may retrace back to the swing high but is less likely to exceed it. Therefore, setting the stop loss above the resistance level means the stop loss will only be triggered if the resistance level is broken.
Setting stop losses in the manner described here does assume considerable risk, but if you believe that the support or resistance levels you have identified are fundamentally sound, then the exchange rate is likely to reverse before hitting either boundary. If however, the support or existence level is breached, setting the stop losses as described here, prevents further losses.
